Amazon BSR and Sales Estimates Checker
Estimate your sales like a pro and how fast you will turn around your stock. Check its sales rank, Keepa’s rank drops, and our sales estimates.
No Credit card required. Cancel Anytime.

- Restrictions
- Sales
- Competition
- Prices
- Profitability
- Automated Score
- Price, BSR and Offers
- Sensitivity Analysis
- Variation Viewer
- Export
- Quick View
ELIGIBILITY CHECKER
See your eligibility status instantly, and easily submit approval requests!
Amazon has designated some categories and products as ‘restricted’ to protect customers. Sellers must first obtain approval before selling any restricted items. Some brands, such as Nike and Gucci, are restricted too. We make it much easier for sellers to check their eligibility status and submit selling applications!


DANGEROUS GOODS
Immediately know Hazmat and Dangerous Goods status of products
The majority of products are safe for consumers to use; however, some items, such as explosives, weapons, and narcotics, as well as toxic or combustible parts, are classified as dangerous goods or hazardous materials and cannot be sold on Amazon. To keep sellers out of trouble, we promptly display the status of hazardous materials and dangerous goods.
IPI RISK
Avoid products where intellectual property infringement claims are likely!
An Amazon IP complaint is an intellectual property complaint from a brand. A brand is complaining and asking that no one use their trademark or sell their goods. We show the likelihood of a seller getting a complaint based on important factors such as seller count, brand name, and existing seller names.


PRODUCT SIZE TIER
Effortlessly know product size tier and dimensions!
It could be quite expensive to work with oversized or heavy products. Costs associated with product logistics, including returns, will be high. We display size tier, measurements, and weight so that the seller is aware of this fact.
MELTABLE PRODUCTS
Prompty display if product is meltable or not!
Products that are heat-sensitive and won’t withstand summer temperatures are referred to as Amazon meltable inventory. Amazon is unable to keep meltable goods in their warehouses year-round. So that sellers don’t waste money, we indicate whether a product melts or not.

PRODUCT SALES RANK
Have a clear grasp of the product’s past and present BSR trends!
The Amazon algorithm automatically determines a product’s sales rank, also known as BSR or Best Sellers Rank, by comparing the volume of recent sales and previous sales data to those of other products in the same category. To help sellers understand how the product actually performs, we display both recent and historical BSR averages.


KEEPA DROPS
Determine actual sales with Keepa Drops!
When a product sells and Keepa checks the BSRs of the products, you’ll notice that the BSR will drop. The more BSR drops, the more sales. We show the Keepa Drops count to provide sellers with an actual sales indicator.
SALES ESTIMATOR
Quick and accurate sales estimates!
Amazon product sales estimates, or the number of units sold of an item per day, are typically based on a product’s best-selling rank within a given category. Sellers must evaluate not only the current rank but also the historical rank in order to make sound business decisions. We help sellers see the big picture by displaying 30-day, 90-day, and 180-day sales averages.

BUYBOX CONCENTRATION
Know your chances of winning the Buy Box!
The Amazon “Buy Box” is the “Add to Cart” and “Buy Now” sections of the product listing. Needless to say, every seller needs it or needs a piece of it. We show competitors’ Buy Box concentration percentages to tell sellers their chances of winning a share of time on Buy Box.

COMPETITION ANALYSIS
Get a full grasp of the seller’s competitiveness on the listing!
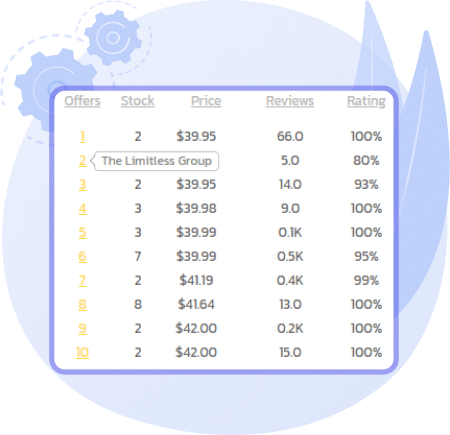
The Buy Box is the ultimate goal, and all other sellers on the listing are always trying to get more of it. The more sellers or competitors on the listing, the smaller the share a seller will get. We swiftly offer all the information required to evaluate the competition, including the overall number of sellers, whether they use FBA or FBM, their pricing, reviews, and ratings.
STOCK LEVEL SPY
Spy on competitors’ stock levels!
One of the best strategies for Amazon Marketplace sellers looking to increase their profits is spying on competitors’ inventory. Using data on inventory levels, you may decide on pricing and replenishing more effectively. We display accurate stock levels for sellers to predict the tendencies of their competitors and stay one step ahead!

AMAZON IS SELLING
Be aware of when Amazon is selling on the listing!
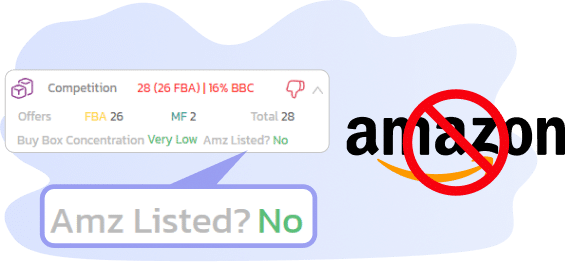
Amazon itself also sells and competes with other sellers. Prevailing in the buy box already demands a lot from the sellers, whereas succeeding in the buy box against Amazon is exceedingly challenging. We display an alert that Amazon has also placed an offer on the listing that is being evaluated.
PRICE STABILITY
Avoid being misled by inflated prices!
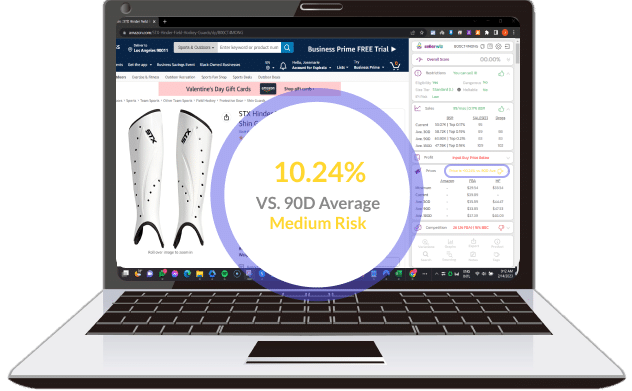
Being initially fooled by the current pricing and then learning afterwards that it is unstable and not actually profitable is one of the common errors sellers make when conducting product research. To help avoid wasting time and effort, we display the percentage difference between the listing’s current price and the 90-day average price.

PRICE STATISTICS
Check out a table with all the price statistics that you need!
While graphical analysis is a terrific way to understand historical pricing patterns, having a summary table with precise data on all the important pricepoints and averages is very useful. We show the minimum and current prices as well as the 30, 90, and 180-day price averages on all fulfillment types.
QUICKLY TEST SELL PRICES
Calculate profitability with the prices from the table with just one click!
A seller or product researcher may spend hours going through hundreds of products daily. Needless to say, time is very important, so well-thought-out efficiency measures are needed. We added a feature where you just click the sell price you want to calculate profitability, and then we automatically plug in that number on the calculator; no more copy and paste!

COMPREHENSIVE CALCULATOR
See true and complete profitability!
An Amazon calculator is an essential tool for sellers to understand Amazon FBA fees, understand product profitability, and analyze if a product is worth the effort and money. We do more than simply calculate; we offer sellers the opportunity to input a lot of well-thought-out data that we know will help accurately determine true profitability.


DETAILED FEES
Know the detailed selling fee breakdown!
Referral fees, fulfillment fees, and closing fees are the three types of Amazon seller fees that you may have to pay when you sell products on Amazon. Depending on the category and selling price of your item, these fees change. We display both the comprehensive breakdown and the sum of all these fees.
BREAKEVEN PRICE
Get an accurate breakeven price right away!
When total cost and total income balance, or are at the break-even point, there is neither profit nor loss from selling the goods. Knowing this can help you examine the worst-case scenario and, perhaps, prevent loss. To help the seller with their profitability calculations, we display the breakeven price in the calculator.

HISTORICAL WIN FREQUENCY
Find out how frequently the product has historically sold for a profit!
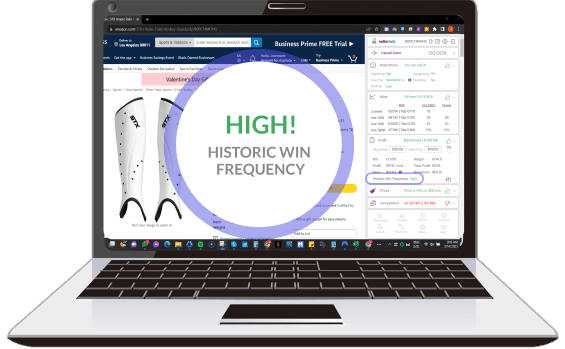
Historic win frequency describes how often the product is sold on Amazon for a profit based on the supplier’s product price. We categorize it into three categories: high, medium, and low. Stay away for the low historic win frequency and keep safe profits!
LEAD SCORING SYSTEM
Make use of our online arbitrage deal score to buy with complete confidence!
The online arbitrage deal score is developed based on a variety of variables, including profitability, sales, competition, potential restrictions, and many other information points. We rate our level of confidence in a deal using a percentage.


PERSONAL CRITERIA
Take control of the deal analysis process! Set your own criteria!
Online arbitrage deal criteria are a set of standards that determine if a deal is acceptable or not. We give sellers the option to specify their target profit, ROI, and BSR. If a deal doesn’t pass the specified criteria, the seller is notified.
KEEPA LIKE CHARTS
Utilize detailed price history charts, ala Keepa!
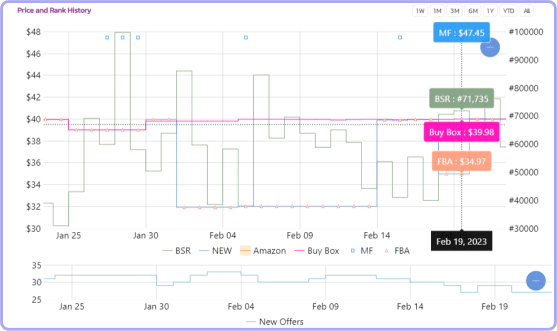
The price history is one of the most crucial pieces of information a seller may utilize to make sourcing decisions. The easiest way to study price history is graphically, so you can see the trends more quickly. We include a keepalike price graph with each listing offer type to help the seller conduct a thorough and quick analysis.
BEST SELLERS RANK GRAPH
Use the BSR graph to verify product demand!
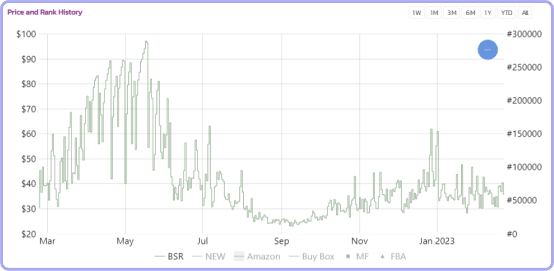
After completing at least one sale, nearly every product in Amazon’s millions of items is given a Best Sellers Rank (BSR). Because of this, the BSR is a trustworthy indicator of how well a product is currently selling on Amazon. In order for the seller to conduct a comprehensive analysis, we graphically display this BSR trend alongside the price history graph.
OFFER COUNT GRAPH
Visualize how many sellers were listed on the listing!
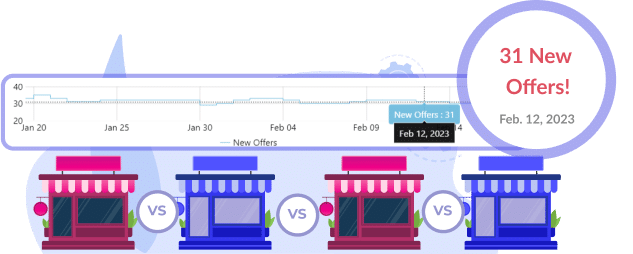
The offer count graph represents how many sellers are on the listing at any given time. We placed it directly below the price and in the BSR chart so that the seller can see the corresponding changes in price and may tell how aggressively the competition may be pricing the product when numerous other sellers are on the same listing.
SIMULATE PROFIT
Safeguard and quickly confirm profits on all historical prices!
Given how unstable most of Amazon’s product prices are, one of the difficulties of product research is figuring out whether the product is actually profitable. As a response, we developed the “Price Sensitivity Analysis Chart,” a tool that will quickly reveal sellers’ odds of profitably selling a product. The more green space there is, the more historic prices are sold profitably.

PRODUCT VARIATIONS
Choose the most profitable variety to sell!
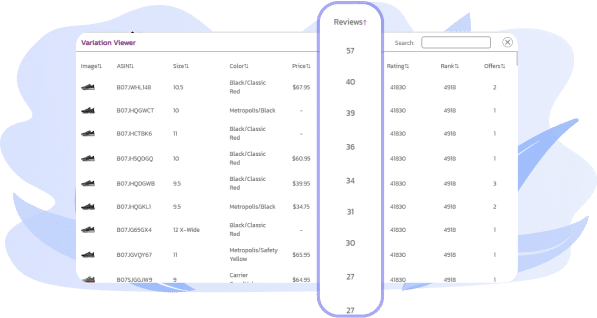
All product listings’ child variations are given the same BSR (Best Sellers Rank) by Amazon. You therefore see the sales estimation for not just one product but for all sizes, colors, or variations of that product when utilizing any software with a sales estimator. We provide a variation viewer table where sellers can define which variation has higher demand by checking its variation-specific reviews and other information.

ORGANIZED VARIATIONS TABLE
Utilize an organized variation information table!
When analyzing and determining which to sell, it’s not only about which variation has the highest demand. All additional elements must be taken into account, including the level of competition or the number of vendors offering the same variant, the variant-specific rating, which measures satisfied customers, and many others. We offer a table that is conveniently sortable so that sellers may perform a thorough variation analysis quickly.
ONE CLICK EXPORT
Export online arbitrage deals with just one click!
Sellers or product researchers shouldn’t have to spend valuable time transferring data or information from an Amazon page to their Google Sheet or Buy Sheet. Instead of copying and pasting, time could be spent seeking great deals! For sellers to save a ton of time, we offer a simple 1-click export.


CUSTOMIZABLE COLUMNS
Customize the export columns for your sheets!
Each seller uses a unique research strategy and takes into account many essential parameters or fields when submitting their leads for the next step of approval or purchase. We totally recognize and support it, which is why we made our export columns completely customizable. You are free to change anything you like, including removing and adding new columns, reordering everything, and doing whatever you please.
EASY SET UP
Be surprised at how easy and straightforward it is to set up!
No need to spend hours setting up the “Export” feature. All you need to do is log into your Google account and click a few buttons. Once you are done, you can export your required data from Sellerwiz to Google Sheets.

STOREFRONT STALKING
Know best products of your competitors!
Sellers or product researchers shouldn’t have to spend valuable time transferring data or information from an Amazon page to their Google Sheet or Buy Sheet. Instead of copying and pasting, time could be spent seeking great deals! For sellers to save a ton of time, we offer a simple 1-click export.
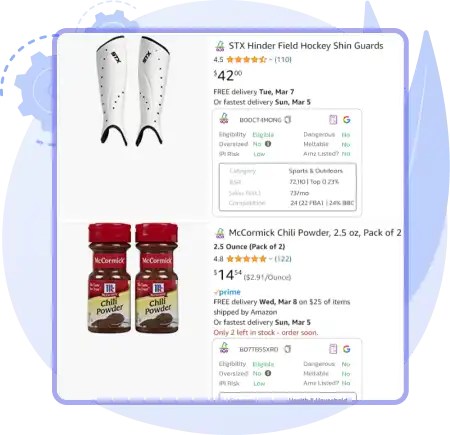

SEARCH RESULTS QUICK VIEW
Identify products potential at a glance!
The “Quick View” feature allows you to see eligibility, restrictions, red flags, and other key information like BSR, sales estimate, and seller count immediately on the search results page. So sellers, don’t waste time and effort opening the details page and pulling extensions for products you know won’t be profitable.